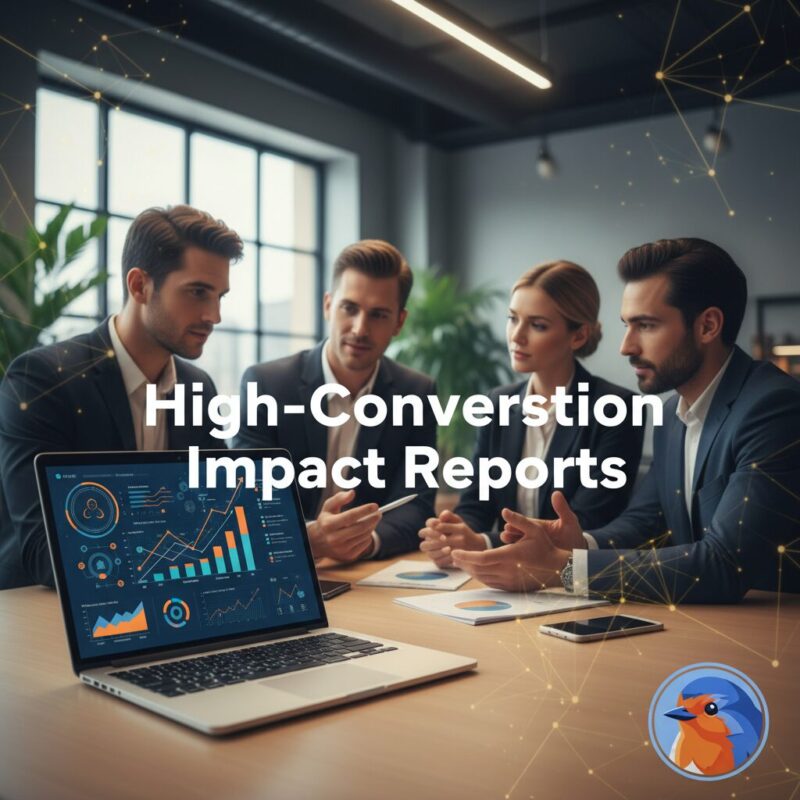
For the “Overwhelmed Visionary” running a nonprofit in today’s economy, the annual report often feels like a tombstone—a heavy, static marker of work already done, created out of obligation rather than opportunity. You know the drill: weeks of chasing program staff for data, wrestling with messy spreadsheets, and agonizing over design, only to produce a PDF that few donors actually read.
But the landscape has shifted. As of early 2026, we are witnessing a fundamental transformation in donor behavior. According to Giving USA and PNC Bank, the modern donor is acting less like a charitable giver and more like an impact investor. They demand transparency, they scrutinize outcomes, and they want to see a tangible Return on Investment (ROI)—measured in social change, not just gala attendance.
This shift presents a massive opportunity. By combining the efficiency of Artificial Intelligence with deep behavioral psychology, you can transform your obligatory annual report into a dynamic “Investment Prospectus” that secures major gifts. The best part? You can do it without burning out your staff.
TL;DR: To create high-conversion impact reports in 2026, nonprofits must shift from retrospective compliance to prospective “investment prospectuses” using the “30% Rule”—letting AI handle 70% of data synthesis while humans focus 30% on strategy. Research shows that framing outcomes via Social Return on Investment (SROI) and leveraging psychological triggers like the “Identifiable Victim Effect” significantly boosts donor retention and Lifetime Value (LTV).
The Psychology of the Modern Funder: Why the Annual Report is Dead
The traditional annual report is failing because it misunderstands the psychological driver of the modern major donor. For decades, the sector relied on the “charity” model: giving out of obligation or pity. Today, we have moved into the era of “agency.”
Donors don’t just want to help; they want to be the hero of the story who effects specific change. When you send a static PDF filled with photos of board members and generic “thank you” text, you are denying them that agency. You are asking for a retrospective pat on the back rather than a prospective partnership.
From Charity to Social Return on Investment (SROI)
High-net-worth donors are increasingly applying business logic to their philanthropic portfolios. They are looking for SROI—Social Return on Investment. They want to know that for every $1,000 they give, $X amount of social good is generated.
However, data alone isn’t enough. It must be framed correctly. According to TrueSense Marketing, successful fundraising hinges on understanding donor behavior and emotional triggers. If you present dry statistics without a narrative anchor, you trigger analytical thinking, which often suppresses generosity. Conversely, if you rely solely on sob stories without data, you lose the trust of the investor-mindset donor.
The Identifiable Victim Effect
The bridge between data and emotion is the “Identifiable Victim Effect.” Research consistently shows that people are more likely to give to a single, identifiable individual with a specific need than to a vague group of millions. Your impact report must zoom in on one story to open the heart, then zoom out to the data to justify the mind.
Bloomerang notes that the modern annual report must evolve into a gratitude report that centers the donor as the problem solver. If your report says “We did this,” you are failing. It must say, “You made this possible.”
The “Investment Prospectus” Framework: Strategy Before Design
Before you open a design tool or an AI prompt, you need a strategic skeleton. The biggest mistake “Overwhelmed Visionaries” make is confusing outputs with outcomes. This distinction is the difference between a report that gets filed and a report that gets funded.
Mission Metrics vs. Vanity Metrics
- Vanity Metrics (Outputs): “We served 5,000 meals.” “We held 10 workshops.” “500 people attended the gala.”
Why this fails: It describes activity, not change. It tells the donor you were busy, not that you were effective. - Mission Metrics (Outcomes): “Because of the 5,000 meals, food insecurity in Zip Code 90210 dropped by 12%.” “Because of the workshops, 40% of attendees secured full-time employment within 6 months.”
Why this wins: It describes impact. It tells the donor their money purchased a result.
According to the Stanford Social Innovation Review, moving beyond vanity metrics is critical for organizational maturity. Donors are savvy; they know that “attendance” does not equal “transformation.”
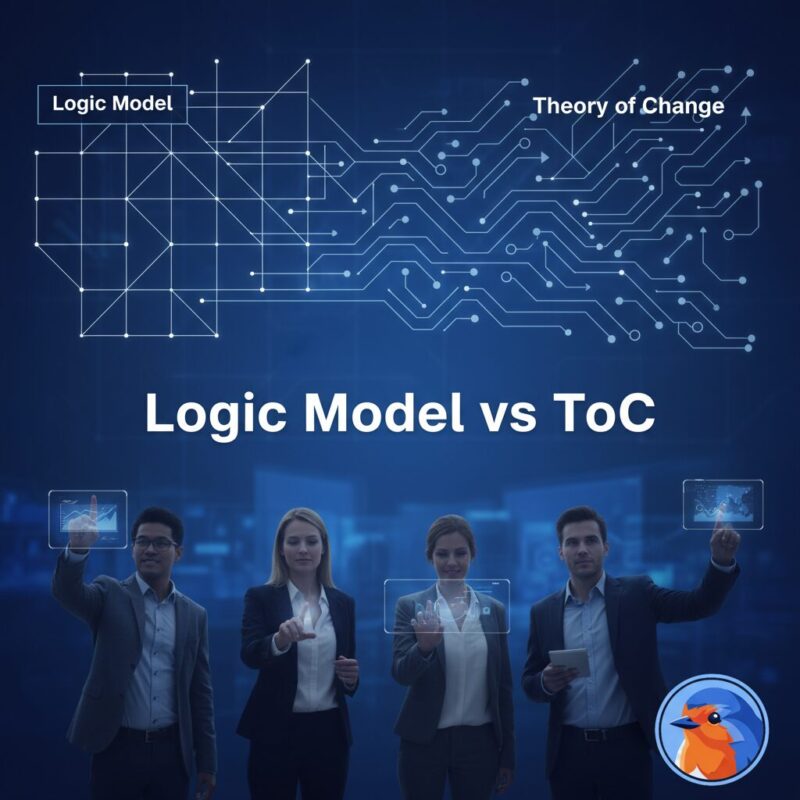
The Logic Model Necessity
To bridge this gap, you need a Logic Model—a visual roadmap that connects your resources (inputs) to your activities (outputs) and finally to your changes (outcomes/impact). This is often the hardest part for nonprofit leaders because it requires deep strategic thinking.
If you struggle to articulate this distinction, use the Theory of Change Builder. This tool helps you map your activities directly to long-term impact, providing the raw structural data needed for a high-conversion report.
The AI Capacity Multiplier: Implementing the “30% Rule”
Here is the reality: You do not have the time to sit and write a 20-page narrative from scratch. This is where the “Capacity Gap” kills fundraising. You have the data, but you lack the bandwidth to synthesize it.
Enter the 30% Rule. In 2026, AI should handle 70% of the heavy lifting in your reporting process. Your human staff focuses on the remaining 30%—strategic alignment, emotional nuance, and funder psychology.
Overcoming Blank Page Syndrome
Using AI tools allows you to bypass the paralysis of the blank page. As noted by NonprofitPro, AI can be a powerful storytelling assistant, helping to structure narratives that might otherwise take days to outline. Instead of staring at a blinking cursor, you can feed raw data into an LLM and ask it to find significant trends instantly.
5 AI Prompts to Infuse Funder Psychology into Your Report
Strategy is useless without execution. Below are specific prompt structures you can use right now to turn raw data into a psychological “Investment Prospectus.” Note: Always anonymize beneficiary data before putting it into any public AI tool.
- The “SROI Calculator”: Turn “cost” into “investment value” by framing outputs as a Dividend Report.
- The “Victim vs. Victor” Reframe: Shift passive language to active empowerment for the beneficiary.
- The “Future-Pacing” Vision: Use present tense to describe what the community will look like in 5 years if the current trajectory continues.
- The “Donor Hero” Insert: Use “You” language to make the reader feel like the primary problem solver.
- The “Compliance Checker”: Align outcomes with United Nations Sustainable Development Goals (SDGs) to appeal to institutional investors.
If you want to automate this process further, the Free Impact Report Generator has these psychological frameworks built into its workflow, saving you the step of prompt engineering.

Measuring Success: KPIs That Matter to Your Board
Investing time in a high-quality impact report is not a “nice to have”; it is a revenue-protection strategy. When you present this new approach to your board, you must speak their language: ROI. According to Sopact, effective impact measurement is the cornerstone of sustainable scaling.
1. Donor Retention Rate
This is your holy grail. It costs 5x-10x more to acquire a new donor than to keep an existing one. High-quality reporting is the primary vehicle for retention.
2. Lifetime Value (LTV)
When donors view your organization as an effective investment, they give longer and more often. Track the LTV of donors who receive the “Investment Prospectus” versus standard updates.
3. Cost Per Dollar Raised (CPDR) Efficiency
If AI reduces production time to 30 hours (the 30% Rule) and raises more revenue, your CPDR plummets. This efficiency is a tangible financial asset.
Frequently Asked Questions
What is the difference between a nonprofit annual report and an impact report?
An annual report is often a retrospective compliance document, while an impact report is a prospective “investment prospectus” focusing on outcomes and future vision to secure funding.
What is the difference between outputs and outcomes?
Outputs measure the volume of work performed (e.g., “100 meals served”), whereas outcomes measure the resulting change in behavior or status (e.g., “reduced local hunger by 15%”).
Can AI write my entire nonprofit impact report?
No, AI should draft about 70% of the content, but humans must provide the final 30% to verify accuracy and add emotional nuance.
Key Takeaways:
- Shift to “Investor” Mindset: Modern donors want to see Social Return on Investment (SROI).
- The 30% Rule: Use AI for 70% of the heavy lifting; focus your team on strategy.
- Outcomes Over Outputs: Stop reporting “vanity metrics” like attendance.
Conclusion: The Future of Fundraising is Data-Driven and Human-Hearted
The era of the “Overwhelmed Visionary” can end today. By adopting the “Investment Prospectus” mindset and leveraging AI as your capacity multiplier, you can produce reports that rival those of national organizations. Give your donors the data they need to trust you, and the story they need to care about you.
Leave a Reply